June 28, 2017
Accounting is a MUST skill to have especially when you are a business owner as it is the basic backbone of any organization. The owner should have a clear visibility of the top line and bottom line of the company, check book and orders, financial statements, account payable and receivable, etc. to evaluate the accuracy and integrity of the business. With business intelligence software like Easy Reports where it is integrated with Tally ERP9 on a real time basis it has become much easier to have an overall view of the financials of the company from the customized dashboard. Even generation of daily reports, MIS reports and analytics based on past data can now be produced in minutes and is just a one click away.
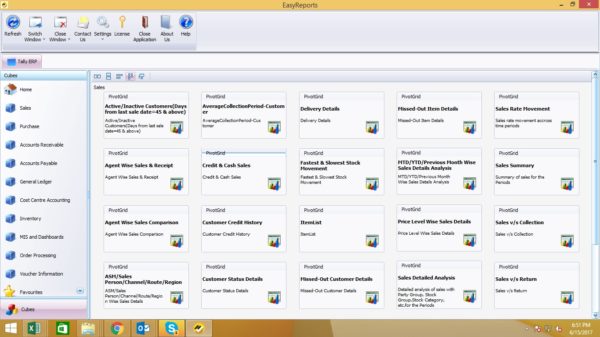
With the help of this real time customized dashboards of Easy Reports, you will be able to get a glance of the following over a period. This helps any business owner to take strategic decisions for the aspired business growth.

- Sales
- Purchase
- Accounts Receivable
- Accounts Payable
- General Ledger
- Cost Centre Accounting
- Inventory
- MIS
- Order Processing
- Voucher Information
As the name depicts, these sections are some of the broad classifications that can be managed through Easy Reports dashboard. Each of these sections has individual reporting dashlets.
- For Sales, you will find reports like Agent-wise Sales & Receipt, you can do a comparison between the revenue generated Agent-wise Sales, Credit & Cash Sales, Customer Credit History, can track Fastest and Slowest moving items, have Sales Detailed Analysis and so on.
- The Purchase tab accommodates four-pivot grids – Purchase Detailed Analysis, Purchase Rate Movement, Purchase Summary, Purchase Target v/s Actual, and Purchase Transaction. With all these, it is just a piece of cake to get all the purchase-related reports at one place and take the right decision at the right time.
- Dashboards like Accounts Receivable, Payable and General Ledger includes analytical reports (in graphical and tabular format) like Credit Analysis, Overdue Payment Details, FIFO wise Ageing report, Receivable Summary, Finance, Staffing and Ledger-related reports, etc. where the data source is Tally (considering the fact – Easy Reports has real time integration with Tally ERP9)
- Cost Centre Accounting Dashboard – as the name depicts, has all the reports that are generated considering “cost” as the leading parameter. Some of the reports to mention are Cost Centre Transactions, Debit Credit breakup – cost center wise, agent wise profitability, cost center balance with revenue, Reconciliation report – to find out missing cost centers , etc.
- The Inventory Dashboard deals with stocks and easy analysis through visual graphics as well as report generation can be possible for Stock Ageing, Stock Ledger Transactions, Daily Stock details and summary, Current closing stock summary, etc.
In short, the Easy Reports business intelligence accounting software not only provides you with all the reports needed for your business, real time dashboards, exception alerts, report scheduling, etc. but also helps you in strategizing your business and optimizing your cash flow so that you are on the rising curve.
