October 11, 2018
Business intelligence (BI) is a system-driven process for analyzing data which delivers key business insights, allowing users to make informed business decisions. Reporting is an important aspect of business intelligence which focuses on data visualization. Reporting tools utilize different components such as charts, graphs, tables and other widgets to present results of data analytics and processing in an easy-to-understand manner, which can help end-users with important decision making. In this blog, we will discuss the top features to look for in a BI reporting tool.
The Role of Reporting in Business Intelligence
BI reporting tools serve a dual purpose. Firstly, data is collected from various sources and presented in a way that is understandable and ready to be analyzed. Secondly, when presenting the data and information, analysis is also included. It means end-users can see and understand the data, as well as act on it. With accurate reporting, organizations can streamline their various work processes. When it comes to evaluating profits and employee performance, reports are handy to make informed decisions.
EasyReports BI: Scalable and Flexible Reporting Solution
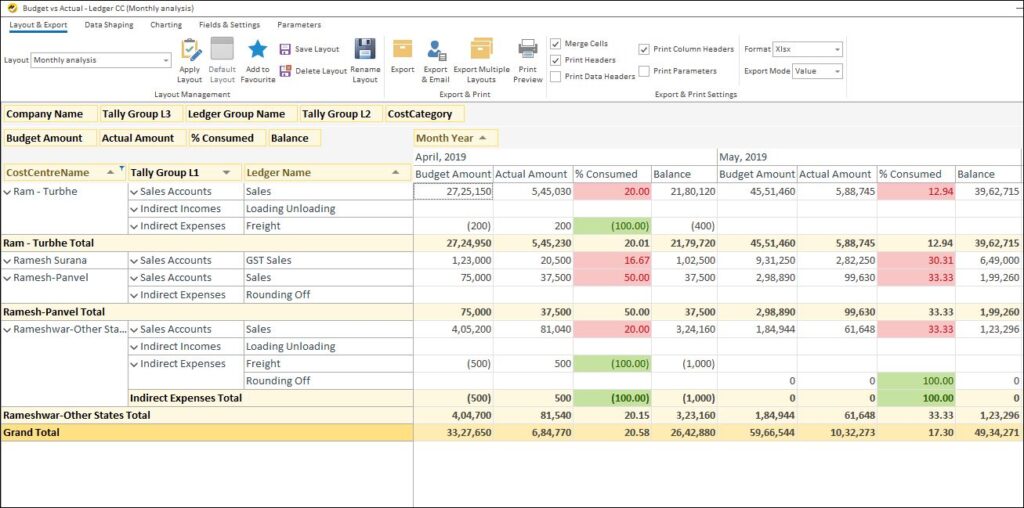
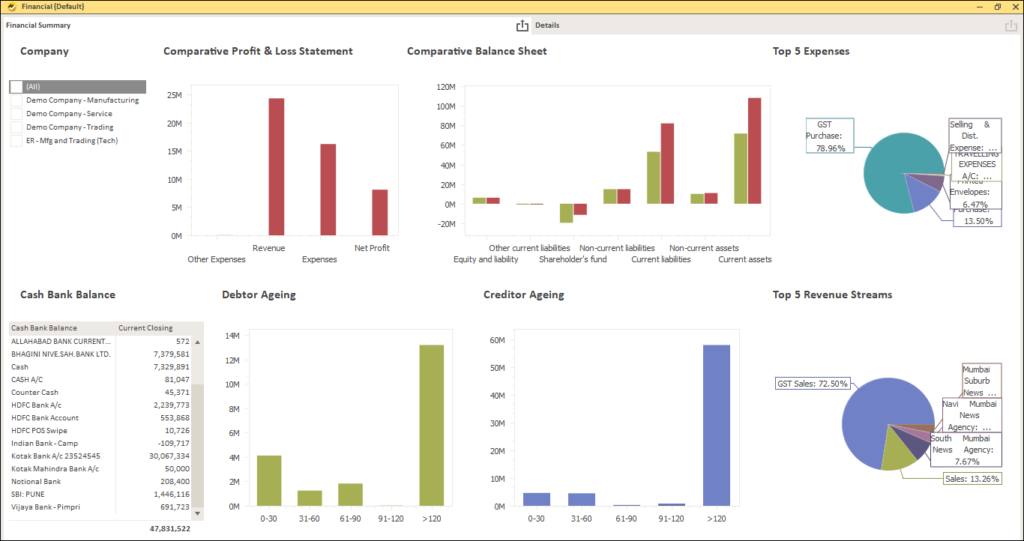
EasyReports BI tool provides scalable, flexible and affordable reporting solutions. Monthly, quarterly, time comparative reports can be made based on top, bottom, ranking and contribution analysis. It allows pivot style reporting for quick analysis of data. Key Performance Indicators can be highlighted in the reports generated. The BI solution also provides customized layouts for making quick and precise reports. Users can auto-generate and auto-schedule their reports as per a desired interval of time.
Reporting is an early step in data processing that produces interactive, actionable information. Interactive reports allow users to drill down through various levels of data at the click of a button. Users are free to navigate, sort, filter and view the data for the best insights. The insights derived from BI reporting tools empower users to make better business decisions.
The market has many advanced reporting systems that can produce paginated reports and pixel perfect reports. Paginated reports are reports separated into different pages, which can be easily printed. Pixel perfect reports are reports where each individual element of the report can be customized down to the pixel level, which are helpful when making detailed reports.
When selecting a new BI reporting tool, remember to look for these following things:
Self-serve reporting
A self-service reporting solution allows users to quickly and easily generate powerful reports, without any required technical skills. This lowers the strain on an organization’s workforce. Employees do not have to rely on data analysis experts for gaining any insights.
Data visualization
Data visualization tools like charts and tables are a way to interact and manipulate data. In the fast-changing world of business today, a higher level of interactivity has become essential for executives to make quick business decisions. Non-technical decision makers can now slice and dice information, sort and filter data, use formulas, and even perform basic data modeling.
Report scheduling
Look for a BI solution with the ability to auto-schedule reports to run at a given time or time period. The system can automatically email reports to individuals and groups inside or outside the organization, without any manual effort.
This saves the time and energy needed to create individual reports for every person.
Delivery output
Advanced BI reporting tools offer many different ways to export data for further analysis or sharing.Common options include exporting to .pdf, .csv or excel, sending via email, or uploading to FTP as well as many others.
Advanced security
Reporting tools must allow organizations to control exactly who sees what. Look for a BI tool that uses groups and roles as well field-based security.
EasyReports BI software offers both role-based security and field level security. Companies can control access with roles, define their own roles, and also control access at report level. There can be filters made based on responsibility.
These above-mentioned points are the top features to look for in a BI reporting tool. To know more about the reporting features of EasyReports BI, log on to www.easyreports.in