
May 3, 2024
In the fast-paced world of sales, success hinges on data-driven decision-making. Whether you’re a seasoned sales professional or a budding entrepreneur, harnessing the power of sales dashboards can propel your business to new heights. These dynamic tools offer a comprehensive view of your sales performance, empowering you to identify trends, track progress, and make informed strategies. Let’s delve into the essentials of sales dashboards and how they can revolutionize your approach to sales.
1. Clear Visualization of Key Metrics for Sales Dashboards:
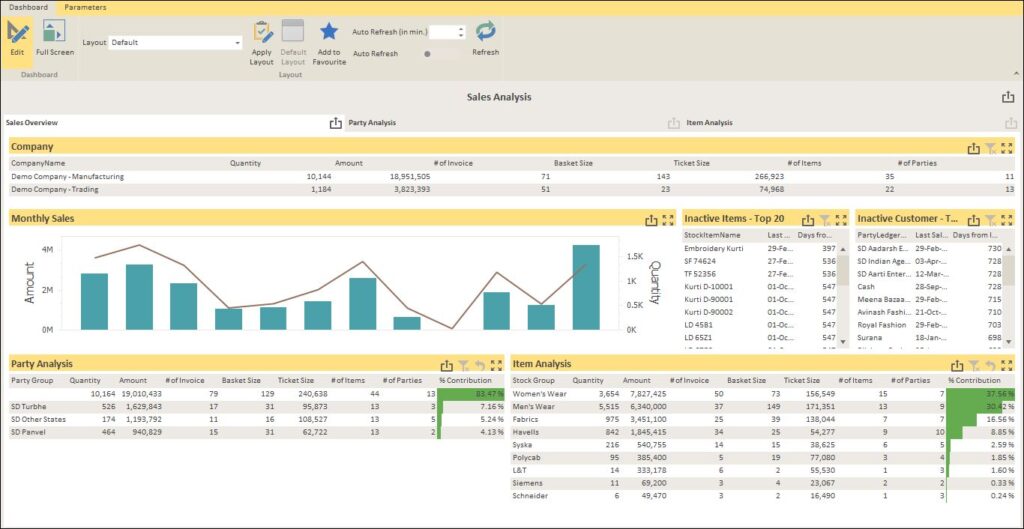
At the heart of every effective sales dashboard lies a clear visualization of key metrics. From revenue and conversion rates to customer acquisition costs and sales pipeline velocity, these metrics provide invaluable insights into your sales performance. Choose visualizations that are intuitive and easy to understand, such as line graphs, bar charts, and pie charts. Clarity is key – ensure that your dashboard communicates essential information at a glance.
(I) Revenue:
The total amount of money generated from sales within a specific period. Revenue is a fundamental metric that indicates the overall health and success of your sales efforts.
(II) Sales Conversion Rate:
The percentage of leads or prospects that convert into paying customers. This metric helps you understand the effectiveness of your sales process in turning leads into revenue.
(III) Average Deal Size:
The average value of each sales deal closed within a given period. Monitoring average deal size helps you gauge the value of your sales transactions and identify opportunities for upselling or cross-selling.
(IV) Sales Pipeline Value:
The total value of all deals in your sales pipeline. Tracking pipeline value provides visibility into future revenue potential and helps prioritize sales efforts to focus on high-value opportunities.
(V) Lead-to-Opportunity Ratio:
The ratio of leads that progress to the opportunity stage in your sales pipeline. This metric helps assess the quality of your leads and the efficiency of your lead qualification process.
(VI) Win Rate:
The percentage of opportunities that result in a successful sale. Win rate reflects the effectiveness of your sales team in closing deals and converting opportunities into revenue.
(VII) Customer Acquisition Cost (CAC) for Sales Dashboards:
The total cost incurred to acquire a new customer, including marketing, sales, and operational expenses. Monitoring CAC helps evaluate the efficiency and profitability of your customer acquisition efforts.
(VIII) Customer Lifetime Value (CLV) :
The total revenue generated from a customer over the entire duration of their relationship with your business. CLV helps prioritize customer retention efforts and assess the long-term value of your customer base.
(IX) Sales Velocity for generating the efficient Sales Dashboards:
The speed at which deals move through your sales pipeline, typically measured as the average time taken to close a deal from initial contact to conversion. Sales velocity provides insights into sales cycle efficiency and revenue forecasting.
(X) Activity Metrics for the Sales Process:
Metrics related to sales activities such as calls made, emails sent, meetings scheduled, and demos conducted. Tracking activity metrics helps evaluate sales team productivity and identify areas for improvement in sales processes and resource allocation.
(XI) Churn Rate:
The percentage of customers who stop using your product or service within a specific period. The churn rate is crucial for assessing customer satisfaction, retention efforts, and overall business sustainability.
(XII) Sales by Product/Service:
Breakdown of sales revenue by individual products or services offered by your business. This metric helps identify top-performing offerings, market demand trends, and opportunities for product/service portfolio optimization.
Including these key metrics in your sales dashboard provides a comprehensive view of your sales performance and enables data-driven decision-making to drive business growth and success.
2. Real-Time Data Updates for the Sales Dashboards:
In today’s dynamic business environment, real-time data is indispensable. Sales dashboards equipped with real-time data updates enable you to stay agile and responsive to changing market conditions. Whether you’re monitoring a promotional campaign or tracking sales performance during peak hours, real-time updates empower you to make timely adjustments and capitalize on emerging opportunities.
3. Customization for Unique Needs :
No two businesses are alike, and neither are their sales processes. The beauty of sales dashboards lies in their flexibility and customization options. Tailor your dashboard to align with your specific objectives, target audience, and sales strategies. Whether you prioritize lead generation, customer retention, or revenue growth, customize your dashboard to focus on the metrics that matter most to your business.
4. Integration with CRM Systems for Sales dashboards :
Seamless integration with Customer Relationship Management (CRM) systems is a game-changer for sales dashboards. By syncing your dashboard with your CRM platform, you can access a wealth of customer data and insights in one centralized location. This integration enables you to track leads, manage customer interactions, and forecast sales performance with ease. The synergy between your sales dashboard and CRM system empowers your sales team to work more efficiently and collaboratively towards common goals.
5. Drill-Down Functionality for Deeper Analysis :
While an overview of key metrics is essential, sometimes you need to dive deeper into the data to uncover underlying trends and patterns. Drill-down functionality allows you to zoom in on specific metrics, time periods, or segments for deeper analysis. Whether you’re analyzing sales performance by region, product category, or sales representative, drill-down capabilities provide invaluable insights for strategic decision-making.
6. Mobile Accessibility for On-the-Go Insights :
In today’s mobile-centric world, accessibility is paramount. Sales dashboards that offer mobile compatibility enable you to access critical insights anytime, anywhere. Whether you’re meeting with a client, attending a conference, or traveling for business, having access to your sales dashboard on your smartphone or tablet ensures that you’re always in the loop and ready to take action.
7. Actionable Insights for Continuous Improvement of the Sales dashboards :
Ultimately, the goal of a sales dashboard is to provide actionable insights that drive continuous improvement. Use your dashboard to identify areas of strength and areas for improvement within your sales process. Whether it’s optimizing your sales funnel, refining your lead nurturing strategies, or incentivizing high-performing sales reps, leverage the insights gleaned from your dashboard to refine your approach and achieve greater success.
In conclusion, sales dashboards are indispensable tools for modern sales professionals and businesses alike. By harnessing the power of clear visualization, real-time data updates, customization, CRM integration, drill-down functionality, mobile accessibility, and actionable insights, you can unlock the full potential of your sales performance. Embrace the essentials of sales dashboards, and embark on a journey towards greater efficiency, effectiveness, and success in sales.