May 23, 2017
There are various sales reports available in Tally ERP9 which are in the “Display” menu of the “Gateway of Tally” menu. The sales reporting of Tally is available under the following menu options:
Display -> Account Books -> Sales Register
Display -> Inventory Books -> Stock Item / Group Summary
Display -> Inventory Books -> Movement Analysis
The first option is the most commonly used sales report while the second option requires some filtering and tweaking to convert it to a sales report. The third option provides some interesting reports which may be useful for a user of Tally ERP9.
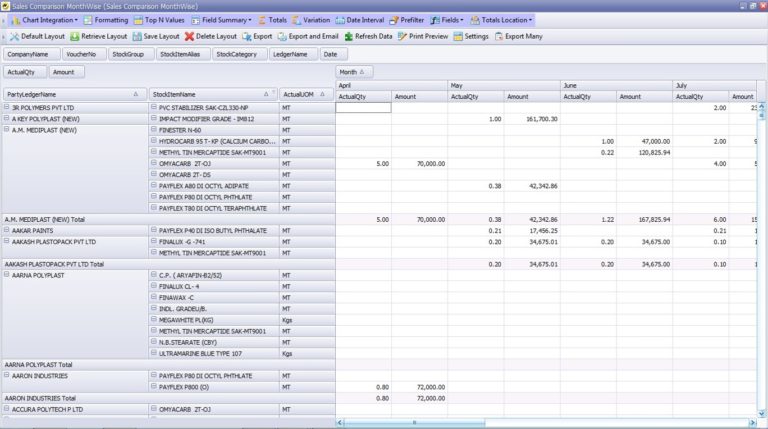
Apart from the above you may visit EasyReports to check the different options of sales reports available. The possibilities of sales reporting are:
- Daily Sales Report
- Monthly Sales Report
- Item Party or Party Item Sales
- Comparative reports for daily, weekly, monthly, yearly – columnar
- Salesperson and sales team-wise reports
- To know more about sales reporting click here
Using the Sales Register as a Daily Sales Report
Go to the menu option specified in option 1 above. The monthly summary screen is shown.
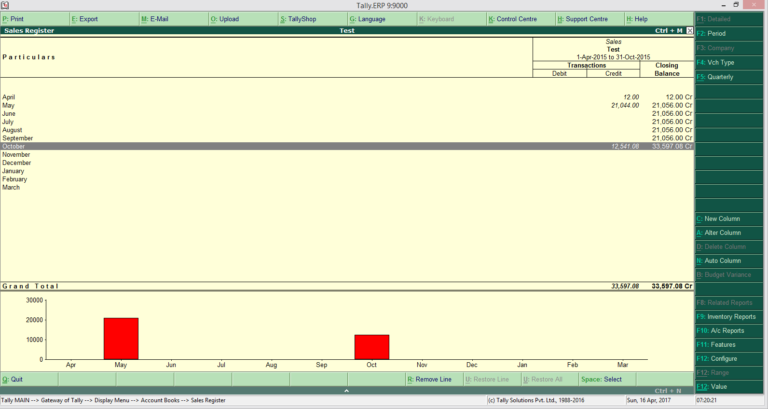
You can click on any month and use F2 -> Period option to set the date for the date you want to generate the daily sales report.
This shows the list of sales vouchers for the day which can be used as a customer wise daily sales report. In case you want additional information such as item details or invoice details then you can click the F12 -> Configure option and select “Show Columnar Register” as “Yes” and put the option in the configuration screen to generate the report with additional details.
You may then click on the detailed option button to generate the report with item details as well.
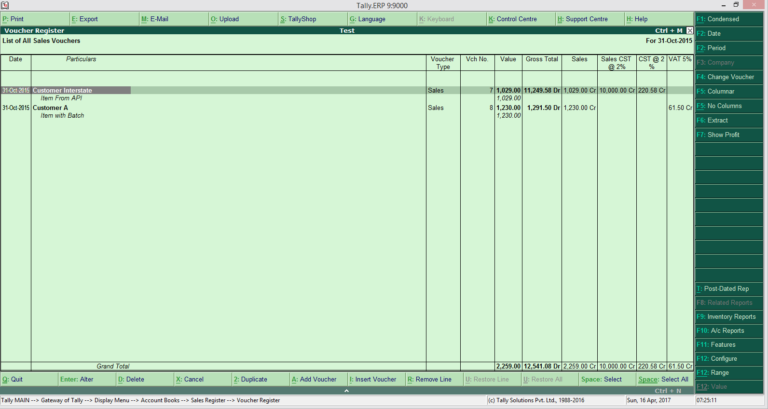
The report can be then condensed using the various options in the configuration screen as may be required.
Generally, you would download the report into excel and then prepare the report in the specified format requirement by the person seeing the report. One of the challenges in the report is that the items are coming as child lines which makes analysis in excel difficult and requires that the user change the format manually. With a large volume of data this may be a time-consuming exercise.
To know more about how you can easily generate a daily sales report in your required format you may go to the end of the article for the solution summary.
Using Stock Item / Group Summary as a Daily Sales Report
The Stock Item and Group Summary reports in Inventory Books are essentially a stock movement reporting system but with filters applied the report can be used as a summary sales report.
Run the Group Summary report and click on the value option to filter the report. Enter the filter as per your voucher types existing in your system.
This may be cumbersome for users having different voucher types defined for sales with non-similar names where multiple filters would need to be defined for each type of report.
Use the F12 -> Configuration option to show only the outwards column and the period option to select the required date.
The report is generated as above with an item wise summary. In the previous option the report was generated customer wise whereas in this report the item summary is available.
The report can be useful for users where only the item summary is required. The disadvantage of this approach is that the filters and configuration options need to be defined every time the report is run and if the user presses escape key by mistake then all the configuration would need to be done again.
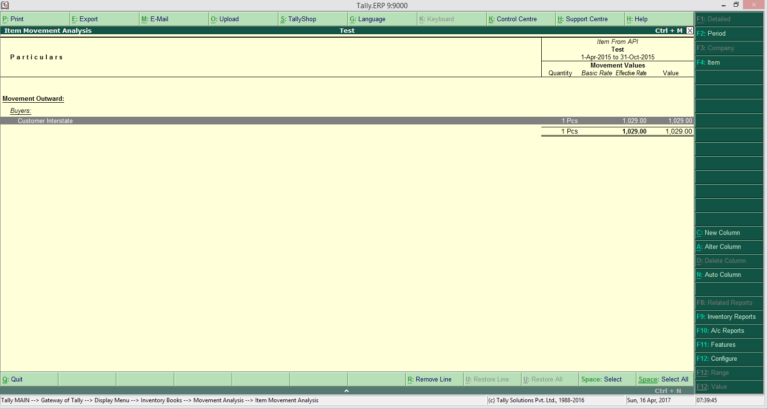
Using Movement Analysis Report
Run the movement analysis report from the Inventory Book menu. In the options shown select the “Group Analysis” option and select “Sundry Debtors”. This will generate the report for all customers for which credit sales have happened. In case you want cash sales then you will need to run the report multiple times using the bank accounts or cash groups and combine the data in excel.
After the report is shown use the period option to define the date for which you want to see the report. Use the configuration option to hide the purchases column is required. The report is shown with the sales information.
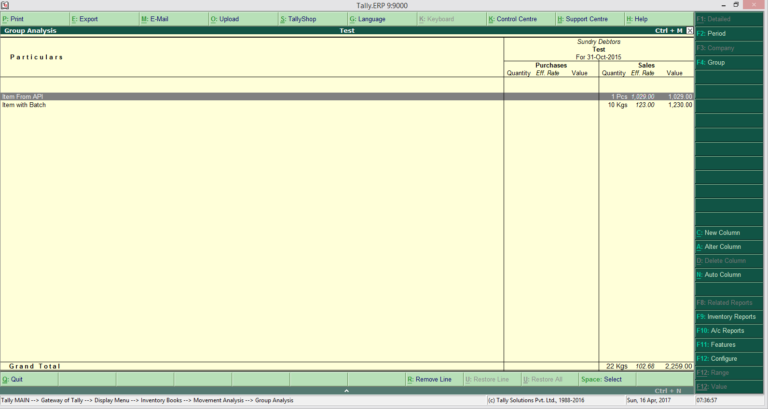
The other options can also be used such as ledger analysis to see the sales for one customer or bank or cash account.
The Stock Item analysis can be used to analysis the customer wise purchases for a single item.
Using EasyReports
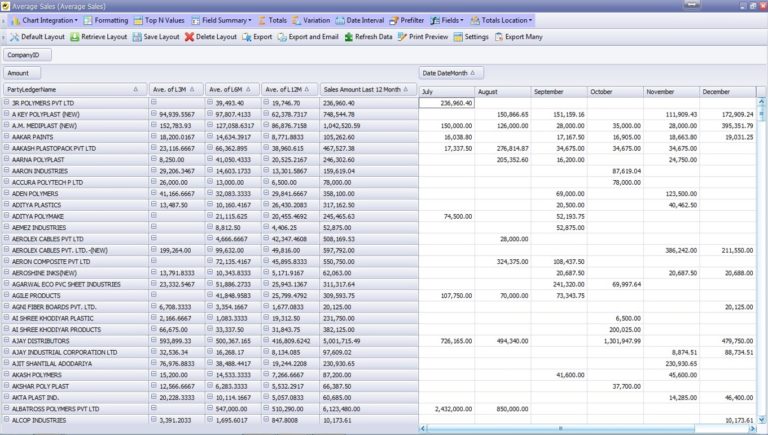
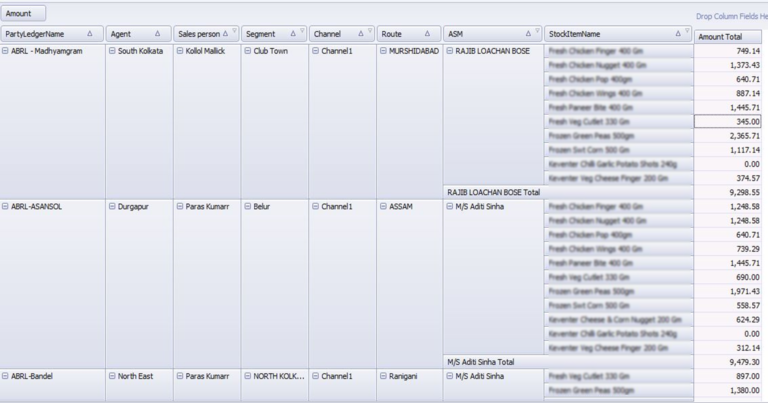
EasyReports BI is a reporting and MIS tool for Tally.ERP9. The software provides various different types of sales reports which can be used for all your sales MIS.
Summary
The options in Tally ERP9 have been shown above for possible options to generate a daily sales report. An organization may want more features and quick reporting for the daily sales report such as reports with saved filters, user defined data, auto-email of the report to specified users, etc. One can explore the use of EasyReports reporting and MIS tool to see the powerful options for generating daily sales reports which can used by Tally ERP9 users to generate all possible report formats at the click of a button.
