Different kinds of reports to meet different reporting automation needs. From Pivots, Grid, Spreadsheets, Formatted Reports we cover varied reporting requirements. Our Zero Code approach ensures reporting development is fast and straightforward
Zero Code Report Designer
Zero code platform with support for multiple data sources
Pivots, Grids, Spreadsheet and Formatted Reports
Predefined reports for various ERPs available
Create data models with filter parameters, e.g. company, dates, etc
Import data from excel for combination with ERP data, e.g. targets, budgets, etc.
Drag and drop designer with no special scripting or coding skills needed
Pivot Reports
Spreadsheet like reports without the complexity
Save unlimited views and filters with layouts
Simple drag and drop interface
Weekly, monthly, quarterly, annual comparisons
Contribution, variance, Top N, budget/target analysis and more…
Drill down into source data
Export to excel with full formatting or raw data
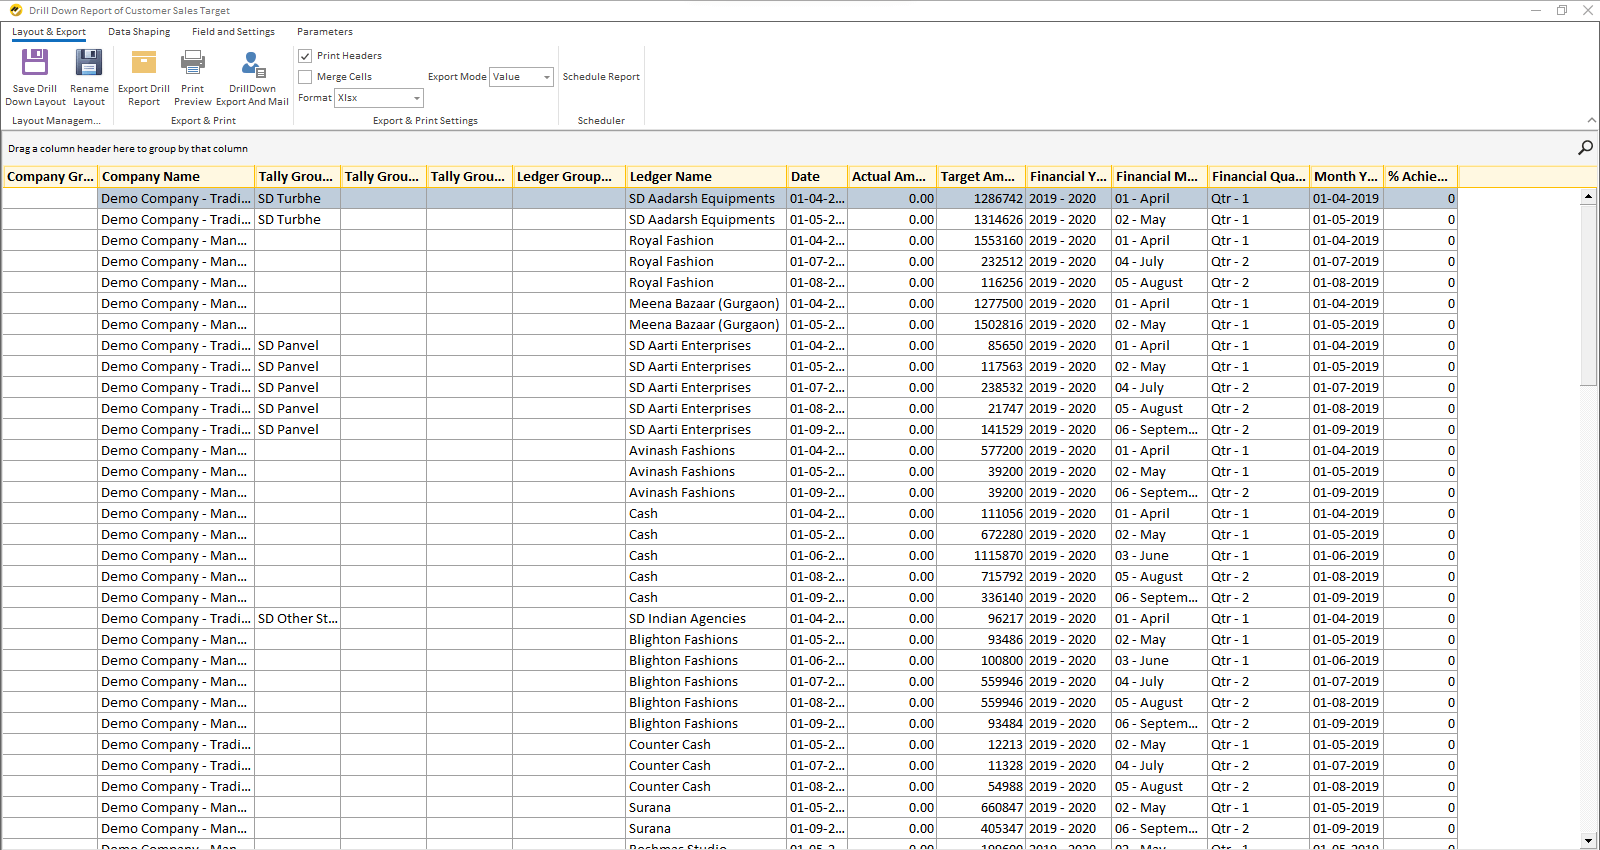
Grid Reports
Build registers and views with drag and drop
Auto-filter row. drop down and advanced filters
Grouping, totaling and sub-totaling
Export into various formats
Support for high data volume*
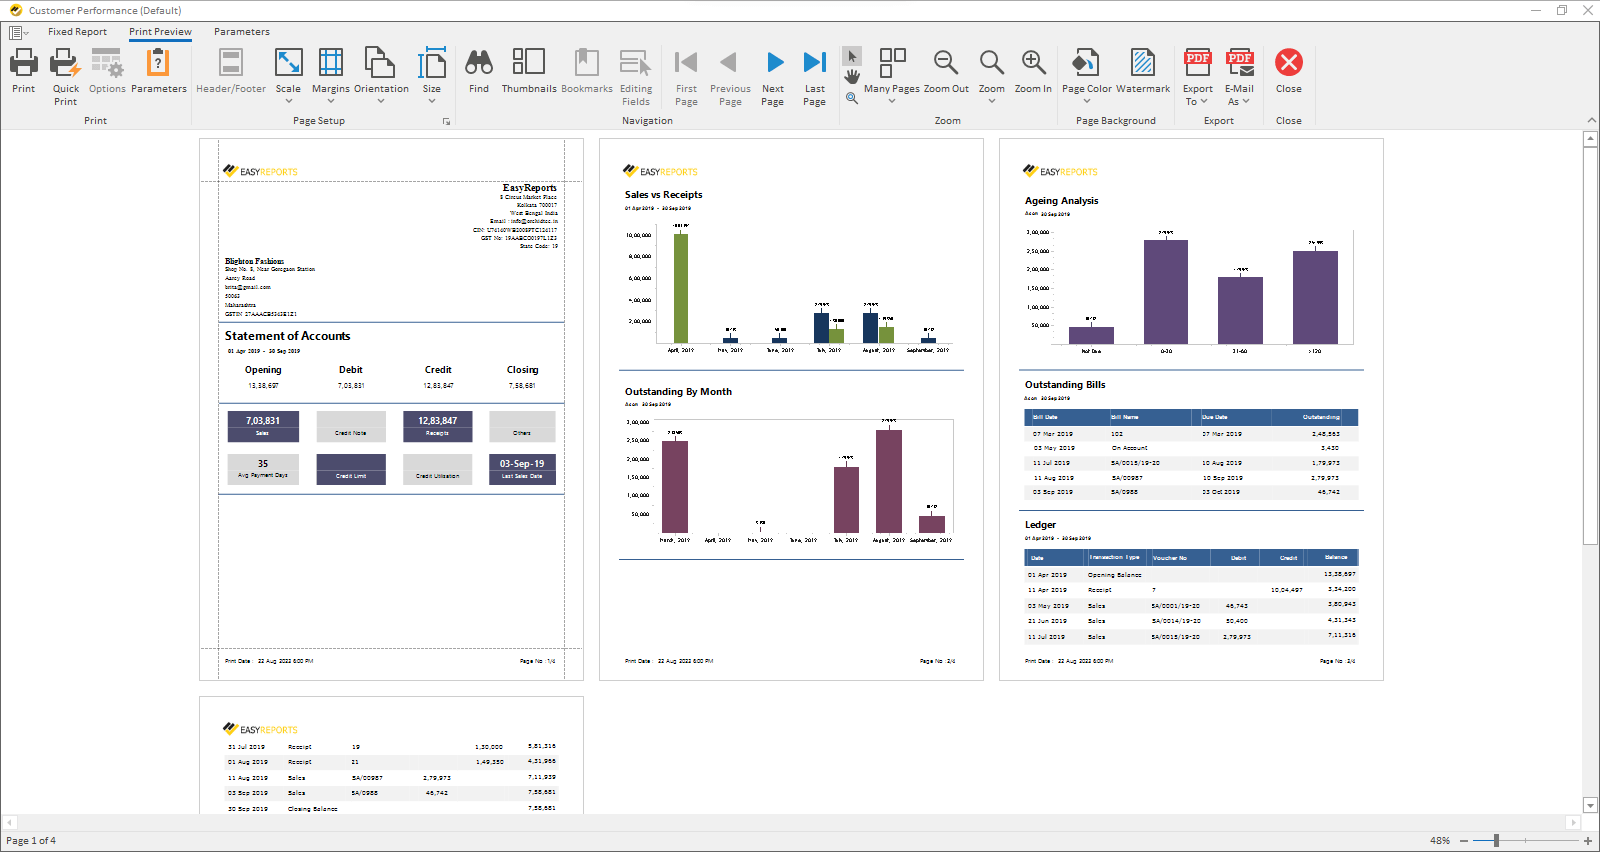
Formatted Reports
Create reports with formatted output in minutes/li>
Drag and drop easy-to-use interface
Wide variety of widgets available
Create statements with multiple tables, charts, etc.
Combine data from multiple sources
Create shareable reports in PDFs, Excel, Word, etc.
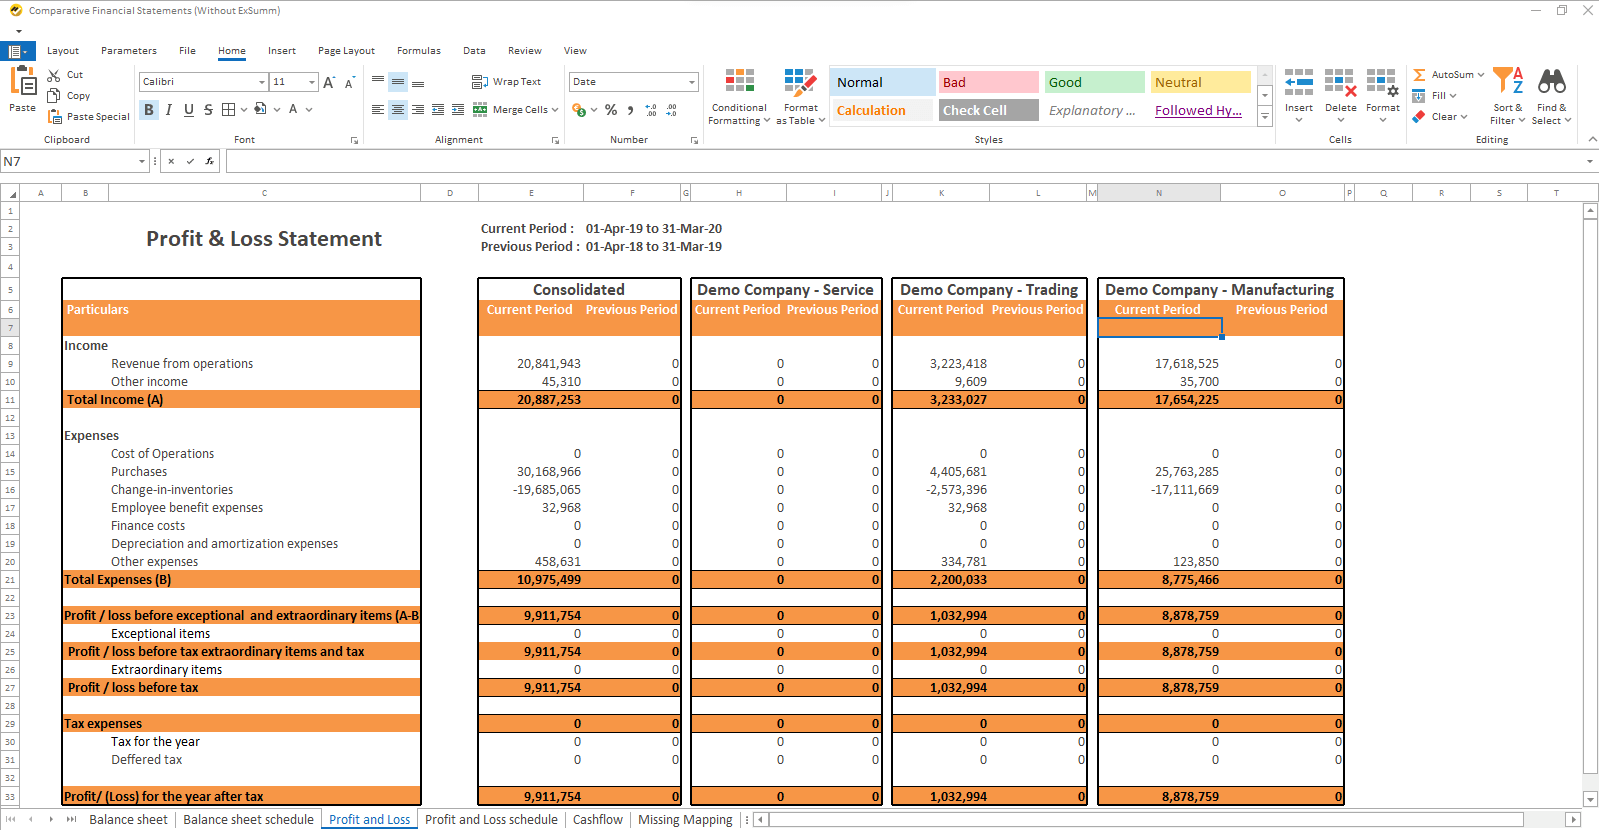
Spreadsheet Reports
Reports in a spreadsheet like interface
Automated data population for linking to charts, tables and pivots
Format reports with your colors and other content
Suitable for internal and automated MIS reports
Balance Sheet, P&L, Cash Flow and financial reports